Creating Flowcharts and Mindmaps with ChatGPT

I’ve been experimenting with ChatGPT and discovered a cool trick that lets you create diverse graph visualizations effortlessly.
Since ChatGPT excels in text generation, you can leverage its capabilities to generate graphs using domain-specific languages (DSL). Luckily, there are open-source tools like Graphviz and MermaidJS, and the best part is that ChatGPT is well-versed in these languages.
The recommended DSLs are:
- Graphviz
- MermaidJS
Ask ChatGPT to convert any text into one of these DSLs, and then use online visualization tools to turn them into actual images.
Recommended tools for visualization:
- GraphvizOnline: Excellent for Graphviz
- Mermaid Live: Ideal for MermaidJS
Crafting a Mind Map
Let’s walk through an example. I tasked ChatGPT with creating diagrams for both DSLs based on fruits and categories as our starting point:
Building a mind map
Let’s use an example to illustrate this. I asked chat GPT to put together a diagram on both DSLs for fruits. We use these fruits and categories as the starting point:
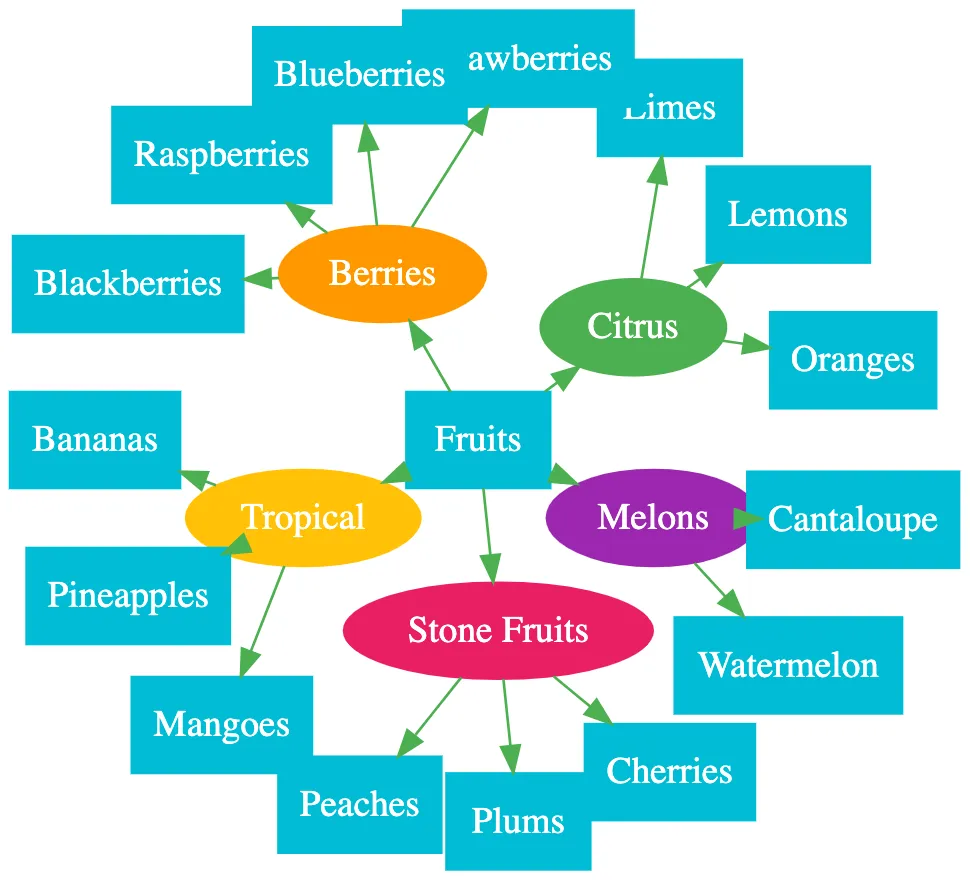
Fruits
- Citrus: Oranges, Lemons, Limes
- Berries: Strawberries, Blueberries, Raspberries, Blackberries
- Tropical: Bananas, Pineapples, Mangoes
- Stone Fruits: Peaches, Plums, Cherries
- Melons: Watermelon, Cantaloupe
GraphViz
The code generated looks like this:
digraph G {
  node [style="filled", color="#00bcd4", fontcolor="#ffffff", shape="box"];
  edge [color="#4CAF50"];

  Fruits [label="Fruits"];

  Citrus [label="Citrus", shape="ellipse", color="#4CAF50"];
  Berries [label="Berries", shape="ellipse", color="#ff9800"];
  Tropical [label="Tropical", shape="ellipse", color="#FFC107"];
  StoneFruits [label="Stone Fruits", shape="ellipse", color="#E91E63"];
  Melons [label="Melons", shape="ellipse", color="#9C27B0"];

  Fruits -> Citrus;
  Fruits -> Berries;
  Fruits -> Tropical;
  Fruits -> StoneFruits;
  Fruits -> Melons;

  Oranges [label="Oranges"];
  Lemons [label="Lemons"];
  Limes [label="Limes"];
  Strawberries [label="Strawberries"];
  Blueberries [label="Blueberries"];
  Raspberries [label="Raspberries"];
  Blackberries [label="Blackberries"];
  Bananas [label="Bananas"];
  Pineapples [label="Pineapples"];
  Mangoes [label="Mangoes"];
  Peaches [label="Peaches"];
  Plums [label="Plums"];
  Cherries [label="Cherries"];
  Watermelon [label="Watermelon"];
  Cantaloupe [label="Cantaloupe"];

  Citrus -> {Oranges Lemons Limes};
  Berries -> {Strawberries Blueberries Raspberries Blackberries};
  Tropical -> {Bananas Pineapples Mangoes};
  StoneFruits -> {Peaches Plums Cherries};
  Melons -> {Watermelon Cantaloupe};
}
And the output looks like this:

MermaidJS
The code on Mermaid looks like this:
graph TB
  A(Fruits)
  B[Citrus]
  C[Berries]
  D[Tropical]
  E[Stone Fruits]
  F[Melons]

  G[Oranges]
  H[Lemons]
  I[Limes]

  J[Strawberries]
  K[Blueberries]
  L[Raspberries]
  M[Blackberries]

  N[Bananas]
  O[Pineapples]
  P[Mangoes]

  Q[Peaches]
  R[Plums]
  S[Cherries]

  T[Watermelon]
  U[Cantaloupe]

  A --> B
  A --> C
  A --> D
  A --> E
  A --> F

  B --> G
  B --> H
  B --> I

  C --> J
  C --> K
  C --> L
  C --> M

  D --> N
  D --> O
  D --> P

  E --> Q
  E --> R
  E --> S

  F --> T
  F --> U

style A fill:#00bcd4,stroke:#fff,stroke-width:2px
style B fill:#4CAF50,stroke:#fff,stroke-width:2px
style C fill:#ff9800,stroke:#fff,stroke-width:2px
style D fill:#FFC107,stroke:#fff,stroke-width:2px
style E fill:#E91E63,stroke:#fff,stroke-width:2px
style F fill:#9C27B0,stroke:#fff,stroke-width:2px
And the image:

Conclusion
The possibilities are endless with this powerful combo. Utilize it to transform your ChatGPT conversations into captivating visualizations.
I trust you found this nifty trick intriguing. Feel free to share your creations with me on X. Let’s visualize the world of ChatGPT together! 🚀
Catch up with me on X (twitter):@juan_allo
Share
---
Similar Articles

Revamping my blog with Astro

7 days of JS by ChatGPT

Teaching LLMs to play the drums
